The end of the contact form

Contact forms are a terminally broken technology. Humans who fill them out have little faith that anyone will receive or answer them. As a result, they often don’t fill out the form and take to some other medium like Twitter or Instagram or TikTok or the current social flavor of the day. Or worse, they just don’t contact you.

A contact form is a gateway to frustration.

But what to do? If you place your raw email address on a website you’re bound to run into the following issues:

  • Spam harvesters will take your email and give you even more spam than you already have.
  • Sorting and sifting the emails

A way to handle these things is by using a tool to encode your email address will limit the usefulness of your email address to spammers. On your website use the resulting code from the tool instead of your form and you’re good to go.

If you have a short list of things that are relevant for contacting you, you can encode a subject line (using the tool above enter your@awesomeemail.com?subject=Your Awesome Subject Line into part where it asks for your email address) and put up a handful of links, people can click the one they want. Maybe a little janky? Beats broken contact forms. Alternatively, you or a friend who knows HTML can make the links look however you want and send email with the awesome subject lines.

“Not going back.”

This is a list of things that, once the Covid-19 thing is handled, are probably never going back. In no particular order.

  1. Buying toilet paper or other paper goods in a physical store.
  2. In-person house closings.
  3. Offices full of people who could work for home / viewing working from home as a perk.
  4. Non-essential work travel involving airline flights.
  5. Open-floor office plans.
  6. Schools/universities that are focused on a physical location.
  7. Department stores.
  8. Something you suggest in the comments below or bring to my attention on Twitter.

Organic Design for Command & Control

Col. John Boyd’s “Organic Design for Command & Control” came up in conversation today so I figured I would put my copy up and make it available. As usual I’ll probably add to this over time. Feel free to use the comments below to ask questions, I’m going back to old school comments-enabled writing.

Audio starts a couple slides in. I found the complete audio but haven’t yet matched it to the picture. Enjoy.

Syndromic Surveillance & Covid-19 Caveats

This article is part of the Syndromic Surveillance and Covid-19 collection on Thoughtfaucet.

There are caveats to all data projects. I do not believe any of these undermine the work and thinking. But they are important to note (and I hope you mention other caveats as well–it improves the project) and discuss if necessary. But all the same, remember that John Snow removed the pump handle for a reason.

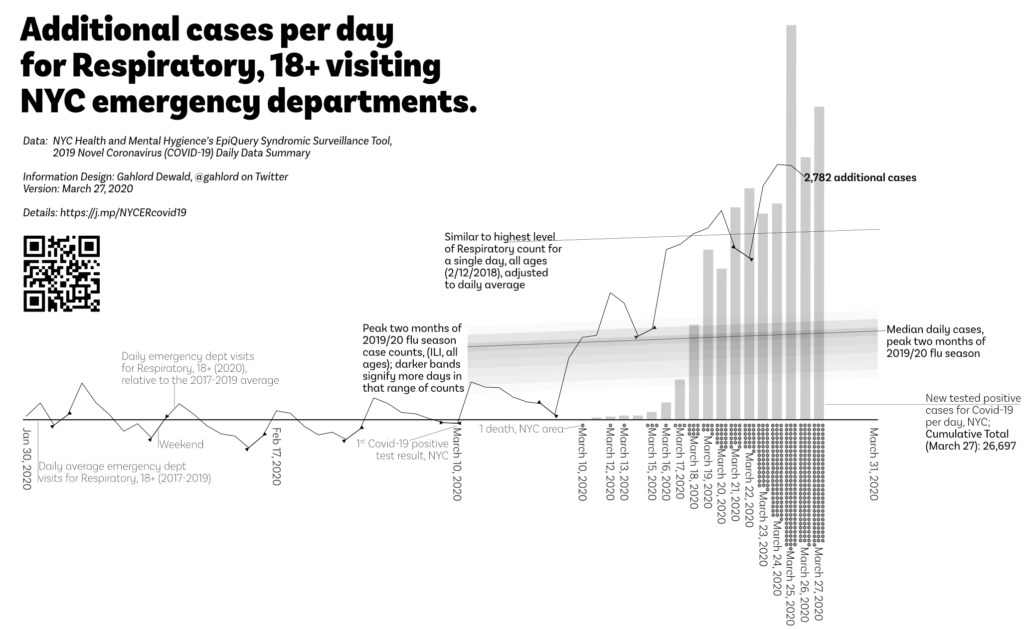
Syndromic Surveillance: Tracking Covid-19 via Respiratory ER Visits

Growth of reported cases of Respiratory issues in the ERs of NYC, most likely related to Covid-19

The above graph uses the NYC Health EpiQuery data (Respiratory case counts) as of 11:50pm EST March 27, 2020 and the NYC Health & Mental Hygiene’s 2019 Novel Coronavirus (Covid-19) Daily Data Summary (tested positive Covid-19 and Covid-19 deaths) as of 4:00pm March 27, 2020. This page is updated regularly with new data as it becomes available.

Syndromic Surveillance & Covid-19 Resources

This article is part of the Syndromic Surveillance and Covid-19 collection on Thoughtfaucet.

In the process of developing the Syndromic Surveillance Covid-19 NYC graph I gathered and read a variety of resources. Some of these are for specialist audiences and others are for more general audiences. This page is an annotated bibliography of the medical journal articles, Twitter threads, and news reports related to the project.

Loadband, an information design pattern for showing intensity of real world factors

This article is part of the Syndromic Surveillance and Covid-19 collection on Thoughtfaucet.

While working on my “Estimating Future ER Load” information design I wanted a way to show how many cases of influenza-like illness an emergency department was capable of handling over a given time.

Coronavirus: Estimating future ER load in NYC

A chart comparing additional cases per day for Influenza-like Illness, 18 and older, visiting NYC emergency departments with tested cases of Covid-19 March 24, 2020
Additional cases per day for Influenza-like Illness, 18 and older, visiting NYC emergency departments. March 24, 2020

The above graph uses the NYC Health EpiQuery data (ILI case counts) as of 1:47pm EST March 24, 2020 and the NYC Health & Mental Hygiene’s 2019 Novel Coronavirus (Covid-19) Daily Data Summary (tested positive Covid-19 and Covid-19 deaths) as of 9:45am March 24, 2020.