Sometimes, when evaluating size and scope of market, it’s useful to look at the volume of traffic for some bellwether sites. In the US real estate industry, those bellwethers would be Trulia, Zillow and Realtor.com.

Here are some graphs of their yearly traffic for 2012 as gathered from Compete.com’s SiteAnalytics product:
Realtor.com unique visits in 2012
Zillow.com unique visits in 2012
Trulia.com unique visits in 2012
Real estate listing aggregation sites, unique visit data comparison
Putting these bits of data into context with one another we can make the following graph and table to get a sense of consumer appetite for real estate listings in the US.
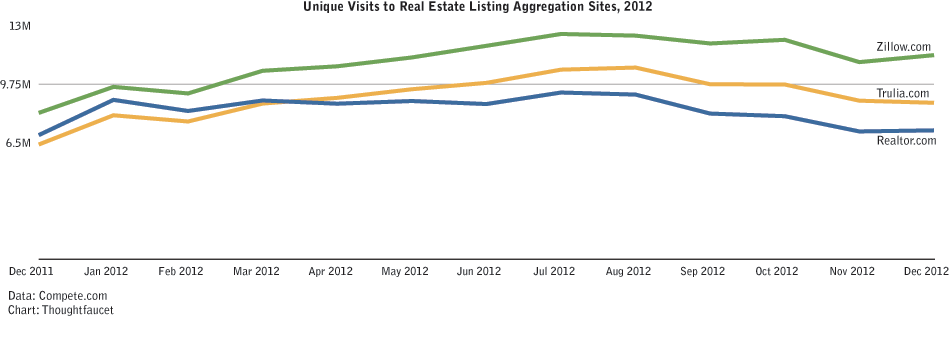
(yes, yes you should be able to click that graph and get a bigger version)
Also, here’s a Google Trends chart to give a sense of general trends on US search data during the same time period.
| Unique Visits 12 Months beginning Jan 2012 and ending Dec 2012 Data Source: Compete.com |
|||
| Leading real estate listing aggregation sites | |||
| Realtor.com | Zillow.com | Trulia.com | |
| January 2012 | 8,879,173 | 9,601,835 | 8,022,473 |
| February 2012 | 8,261,617 | 9,237,105 | 7,676,384 |
| March 2012 | 8,844,191 | 10,496,589 | 8,674,259 |
| April 2012 | 8,666,804 | 10,746,196 | 8,990,876 |
| May 2012 | 8,815,417 | 11,237,935 | 9,469,630 |
| June 2012 | 8,646,932 | 11,884,682 | 9,824,752 |
| July 2012 | 9,287,168 | 12,543,174 | 10,559,276 |
| August 2012 | 9,173,847 | 12,451,147 | 10,675,335 |
| September 2012 | 8,116,984 | 12,015,737 | 9,746,409 |
| October 2012 | 7,970,776 | 12,218,250 | 9,734,571 |
| November 2012 | 9,734,571 | 10,978,144 | 8,833,360 |
| December 2012 | 7,183,649 | 11,366,594 | 8,716,289 |
| Total 2012 | 107,891,870 | 142,934,988 | 117,322,254 |
By tallying up the total unique visits that Compete estimates went to these three real estate sites we can arrive at a ballpark figure of 368,149,112 unique visits that are interested in real estate listing data. This number seems a little off when we take into account that the US Census Bureau estimates the 2012 population of the US to be 313,914,040.
So now is as good time as any to mention…
Caveats
When dealing with data it’s always good practice to be open and honest about ways in which the data may be flawed. This helps everyone make better decisions and also helps improve the quality of data gathered in the future.
I don’t include these caveats to undermine the value of this data, rather I want everyone to have as few suspicions as possible about this data and what value it may have for them. It’s far more dangerous to consider data for which no caveats are mentioned.
Here are some caveats to consider when using this data.
This data may not mean what you think it means
Some of these unique visits may not be people interested in real estate listing data. For example, they could be real estate professionals checking to see if their advertising is running, or other people just randomly surfing the internet somehow.
Unique visitors are not people
In web analytics, a unique visitor does not equal an individual person. Instead, a unique visitor is an instance of a piece of hardware: a phone, a tablet, a computer. So, for example, one individual could access one of the sites using a phone, their computer at work, their laptop at a coffee shop and their desktop computer at home. This single individual would generate four “unique visits.”
I suspect that this accounts for much of the cognitive dissonance generated by comparing the total unique visits to the population of the US.
This data is generated via panels, not direct observation
Compete.com has a useful and documented methodology for how it generates traffic estimates. But it is panel-based and is therefore susceptible to all the same weaknesses of panels. For example, it could be that people interested in real estate listing information are over or under represented on the panels.
Aside from gaining access to each of the company’s analytics data, however, this issue is unlikely to be overcome.
I am a human being
It is entirely possible that I made an error somewhere along the way while gathering and presenting this data. I certainly did my best to check and double-check my work. But the fact remains that, as a human, I am fallible.

Jay T. from Zillow here. As always, an interesting look Gahlord.
There are noticeable dips in all three sites in roughly Q4. Think that’s just seasonality? (Personally, that’s my take. See the same trend year-over-year on all my agent/broker sites as well, albeit with a significantly lower number of UV’s!)
And you’re human, true, buy you’re awful darn close to never having to worry about your data/analysis being fallible…
Thanks for stopping through Jay!
I’m going to do a more analysis-y post on this later–just wanted to get a nice collection of date in one place first. But since you bring it up… 🙂
Q4 dip across the board is definitely the “traditional” North American holiday dip. Happens every year. You also see it in the simple Google Trend interest graph as the second half of the slope in interest for the term “real estate for sale” (you’d see the same general curve for whatever your favorite “real estate intent” phrase is filtered for USA.
What’s more interesting is Q3. That is where your company, Zillow, locks in the audience numbers for the year; notice how–particularly in Sept-Oct–Zillow raises incrementally vs the other aggregators holding steady or declining a bit. This is, in terms of unique visits, the defining moment of 2012 for these companies.
It looks subtle, but it’s really the thing here.
Re: fallibility
I think what sets my work apart in this industry is simply my willingness to be human and not expect the data itself to have all the answers. This allows my clients and friends to reach their own conclusions and improve everyone’s insights. It’s the “let’s” in “Let’s make things people like.”
I’m very pleased that this appears to be having the desired result.
Thanks again for reading and giving your thoughts on all of this Jay.
Nice post Gahlord, Any error in the interpretation of data is resolved by the S.W.A.G factor being understood by the reader. In any case fallibility is not what I think of when I think of you –
I wish we had more data though. Without knowing what the unique visitors were looking at, one might wonder if some people were on Zillow to use their AVM to obtain Zestimates. Its just uninformed guesses without knowing what they were looking at though. – I do enjoy fantasizing that every one in the US was looking for property to buy…
In any case, without the year over year data, it seems a jumpable but unsupported conclusion that Zillow gained some market share but even more that Trulia gained share over Realtor during the year…
Thanks Bill, you’re too kind.
I agree that it would be nice to have more data. But something tells me that is unlikely to happen. At least until we get standard auditing practices like in accounting and can then have some sort of neutral/3rd party web traffic auditing. I’d be more than happy to start such a firm if the three companies in question are interested in that. 😉
You’re absolutely right to point out that we have very limited insight into the intent of each of these visits. And that’s an important thing to keep in mind. Like all web analytics, it’s a little bit hairy and there are many opportunities for fuzziness in the data.
This is part of why I kept the data to what I could gather through Compete: so that all the errors/etc of technology would be applied equally.
The data, such as it is, suggests that Realtor stood still after making a wrong turn March/April. This allowed for Trulia to pass Realtor.com. Zillow and Trulia stay in sync until the end of summer when Zillow has a less pronounced seasonal dip than Trulia and further increases the lead.
I can tell that I better do some actual analysis soon or else I’ll end up doing it piecemeal in the comments. 😉
I want to finish reading Rob’s excellent strategic analysis of the SEC fillings of Zillow/Trulia/Move (paid content but think of the time you’ll not be spending reading SEC filings) before I dig in too deep though.
Do you think when Zillow changed to a model of giving Premier Agents wordpress type websites which puts out more individual sites using Z data has had an effect on the data. Of course the agents may visit Z more to update their site as well. It seems like a brilliant strategy for Zillow. Agents sending traffic to sites that in effect Zillow owns and creating content for something an agent, in effect leases?
Loren I don’t think that the Premier Agent sites have had a huge impact on Zillow’s traffic. But I don’t have any real data on that. I would have to look into it more.
Good idea!