Seeing Covid-19 in Influenza-like Illness, NYC 2020

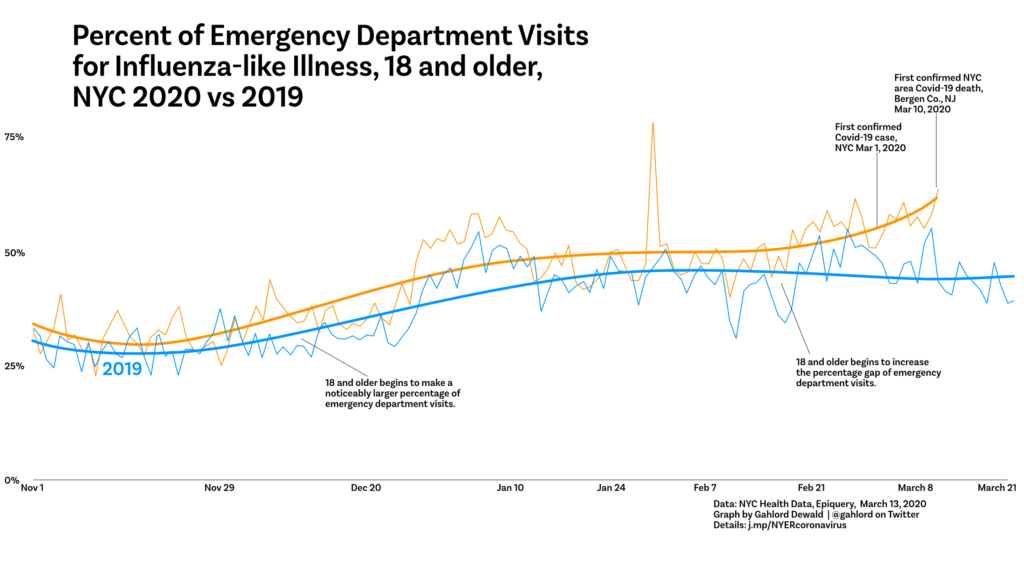
Percent Influenza-like Illness Emergency Department visits, 18 and older, for NYC 2020 vs 2019

This article is part of the Syndromic Surveillance and Covid-19 collection on Thoughtfaucet.

This document outlines the thinking behind my initial chart, trying to see if there was anything to the idea that Influenza-like Illness could be used to spot Covid-19 in NYC.

A thread on Twitter by Farzad Mostashari mentioned EpiQuery, a data collection maintained by NYC Health. The data consists of emergency department visits broken down by date, coarse age groups, borough of New York City, and what sort of symptoms the person was reporting.

Why do ad clicks not match up with Google Analytics data?

This is a question I get just about every week. Someone has an advertising distributor that charges by and reports by clicks. Those clicks don’t match up to the number in Google Analytics. Much worry ensues.

Here’s my standard answer on this topic, it covers most sitatuations:


Ad clicks and GA data:

Differences between clicks and what shows up in GA often can be accounted for in the following ways (in order of how I most often see them):

  1. Make sure the timeframes are the same and that they do not include the present day (GA can have a 24 hr lag in number crunching and thus underreport if comparing with current-day-included click data).
  2. Different measures: for lead gen businesses I typically measure Users. Click data is more closely matched to Sessions. A single User could, in theory, click an ad multiple times resulting in multiple clicks but only one User.
  3. Clicks are measured at the ad distributor’s site. Users/sessions are measured at your website by GA once the page has loaded enough to get the GA script. In theory, people can click an ad and decide to bail before your page loads enough to run the script. In these cases, a click will be measured by the ad distributor but no users/sessions will be measured by GA. Sites with slow load times are especially at risk for this situation; users lack patience for the page to load.
  4. Humans clicking ads twice because of the urge to double click everything. Not much to do here, but it will result in more ad clicks than sessions/users. This tends to be a constant level of noise across the internet.
  5. Old fashioned bot-driven click fraud. GA will not record data about spiders and bots as a user or a session. Some ad systems will register clicks from bots. This is pretty rare. I include mostly for completeness.

Dealing with the difference between ad reporting and GA reporting:

There are a few things that can be done to help with this. One is to make a dashboard that gives you sessions data so you can compare that more easily with clicks.

Another, if the difference is still great, is to simply evaluate the performance of the campaign based on the data in GA. So take the ad spend and distribute it by the actual users or sessions that arrive on site. Be certain to let your ad representative know that this is how you are evaluating performance. This is a good practice regardless, though it does require a spreadsheet.

The clicks are ultimately not the important thing. Ad sellers want you to think about the clicks because that is what they sell. They want to sell you traffic because that’s all they can do. For lead gen businesses, like like most b2b and many b2c businesses like real estate or main street businesses, you want to buy the opportunity to shake someone’s hand.

The best way to stay focused on what’s important for your business is to assemble the data in a way that is meaningful for your own goals. It’s a little bit of sausage-making and inevitably involves some manual labor.

Doing this work helps to answer the real question which is: How much money does an email address cost from this ad distributor? If we do this for each of our different efforts we can discover which is providing the most value per dollar. That knowledge can then be used to inform decisions about ad spends etc.

Napkin sketch: A news business model free from advertising

(Originally published in Sept 2015 but sadly still relevant.)

We know that advertising in all its forms is cluttering and degrading our experience of the web. Great stories and bits of news are accompanied by six-packs of “26 gay celebrities, you’ll never believe #4!” and “Stop bellyfat with this great tip to end credit card debt!”

It’s ridiculous. Even the “good” ads aren’t that good. The advertising is abysmal, a joke.

Aside from the quality of ads, the technology is abysmal as well. How much of your wifi and cellular time is spent waiting for a garbage ad to load?How often does the ad tech break the system entirely, forcing reloads, etc.?

By listening to media companies, we learn that Continue reading “Napkin sketch: A news business model free from advertising”

Failure and imagination

There are a large number of things wrong re: the situation with young electronics enthusiast Ahmed Mohamed being taken from school in handcuffs for bringing in an electronic clock. Those who are interested in innovation in America should watch this story closely.

The thing I want to focus on in this article is the following quote from Irving police spokesman James McLellan in the Dallas News:

“It could reasonably be mistaken as a device if left in a bathroom or under a car. The concern was, what was this thing built for? Do we take him into custody?”

This statement is important because it is an excellent example of Continue reading “Failure and imagination”

Pattern Recognition: Entryways

Anything that flows information or physical objects in one direction, can likely feed them in the other direction as well. Often this is clear and obvious, but in moments when time and attention are not available the “opposite direction” is less obvious.

Learning to identify the pattern of Entryways can be useful in strategic considerations. In a defensive posture, recognizing Entryways can prevent a loss. In an aggressive posture, Entryways can provide a means to reach an objective. In a neutral posture, recognizing Entryways can show how resources or information will flow in the near future.

For the really meaningful Entryways, additional thought and contemplation is required to understand the “opposite direction” of the flow. Most of the time the flowing objects (whether physical or informational) are not exactly the same. But sometimes they might be.

Here are some examples of Entryways.

Bayley Hazen Military Road: This road was first proposed in the mid 1770s as means for the US Continental Army to invade Quebec. Eventually Washington realized that a road that could be used to speed troops’ journey north could be used equally to speed troops’ journey south.

Diverse Solutions and Zillow: Diverse Solutions is a company that provides an integration with the overly complicated database structure built by the real estate industry, called the MLS. It allows data to flow from the MLS to a website (typically powered by a content management system such as WordPress). The system is popular with real estate agents, who are typically the ones who create the MLS data in the first place.

Zillow, the real estate portal, purchased Diverse Solutions. One of Zillow’s continual challenges is access to real estate data; some real estate practitioners view the company as an existential threat and not an advertising partner.

Web technologies such as that provided by Diverse Solutions and others, can very easily become a means for real estate agents to submit data directly to Zillow should trouble ensue with more formal access to the various MLS databases. In some ways, it might turn out to be more efficient for Zillow for this to occur anyway.

A website for publishing data can very simply become an interface for submitting data to a database. In this way, many website platforms are Entryways for a variety of data.

Web content: People can consume content from the web in a variety of ways. Information flows from the screens to the people. Simultaneously, information is flowing back from the people to the publishers of websites. Via web analytics and a variety of other technologies, information about people and their interests/motivations/desires etc flow back to the publishers of web content.

This is especially true for web experiences which involve forms or search fields etc. By flowing information back to the web publishers, people receive some information.


If you can go in the door you can go out the door. Consider what is leaving your organization and by which Entryways. Understanding how the Entryways work could lead to greater understanding of human behavior. Perhaps you’ll find a way to shift the location of a competitor’s Entryway or find a more desireable Entryway for your customers.
Some data on a 100 day content project: listens

Followers of this blog have probably been wondering what has taken over the site for the past 100 days. The 100 Days of Bass project is a fun content experiment I’m running.

Initial listen data for the project regarding listening behavior of the audience

Data on listening is coming from Soundcloud’s analytics. I have a pro account so I get a little bit more than the free, but not as much as the premium account. Soundcloud’s tools and services for paid accounts are pretty miserable (entirely-Flash-driven miserable). But the data is interesting to consider so here it is.

100 Days of Bass Data April 7 to June 14, 2015

  • 4,482 listens
  • 199 downloads (does not require a Soundcloud account)
  • 51 likes (requires a Soundcloud account)
  • 7 comments (requires a Soundcloud account)
  • 7 reposts

The interface tops out at 50 countries represented. The top six had more than 100 listens each, in order: United States (2,727), UK (529), France (234), Netherlands (143), Germany (118), Canada (105).

The listens were mostly stacked up at the beginning of the challenge, in April. Total listens per month sloped down from there. Likes were more evenly distributed month to month.

It will be interesting to see what, if any, long tail listens get generated now that the program is complete. I have a few more things to do in terms of “promoting” the content but probably by the end of the month these will all be complete and we can watch the passive phase of the content take over.